
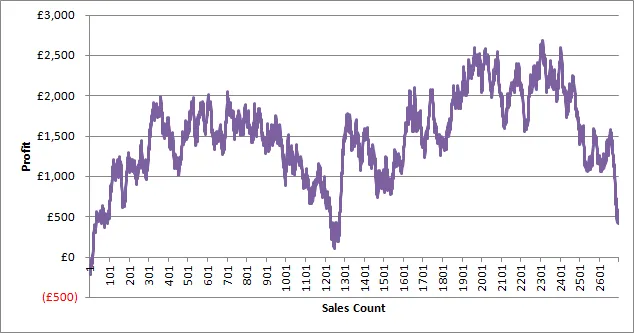
Asking for a running sum in a report is a common thing but this week I was asked to create a running sum for a particular customer against number of facts. What I mean here is to create a graph of count vs amount (sort of like a Pareto except in transaction order). So something that looks like graph above.
This is a well rehearsed subject in MDX. You can either use recursion:
With Member [Measures].[Running Sum]
As
    [Internet Sales Order Details].[Sales Order Number].PrevMember
    +
    [Measures].[Internet Gross Profit]
Member [Measures].[Running Count]
As
    [Internet Sales Order Details].[Sales Order Number].PrevMember
    +
    1

Select {
    [Measures].[Running Count],
    [Measures].[Internet Gross Profit],
    [Measures].[Running Sum]
} On 0, Non Empty {
    [Internet Sales Order Details].[Sales Order Number].Children
} On 1
From [Adventure Works]
Where (
    [Customer].[Customer].[Brian Watson]
)
Or, iteration (thanks to Chris Webb for some help on relative performance) which should perform better, especially on AS2008.
With Member [Measures].[Running Sum]
As
    Sum(
        {Null : [Internet Sales Order Details].[Sales Order Number].CurrentMember},
        [Measures].[Internet Gross Profit]
    )
Member [Measures].[Running Count]
As
    Count(
        {Null : [Internet Sales Order Details].[Sales Order Number].CurrentMember}
    )
Select {
 [Measures].[Running Count],
 [Measures].[Internet Gross Profit],
 [Measures].[Running Sum]
} On 0, Non Empty {
 [Internet Sales Order Details].[Sales Order Number].Children
} On 1
From [Adventure Works]
Where (
 [Customer].[Customer].[Brian Watson]
)
[However, on my x64 laptop the second version takes longer to execute YMMV.]
This is OK for AdventureWorks but my real degenerate dimension has many millions of members and this just doesn’t scale. I contemplated using Reporting Services RunningValue() function but as far as I can tell you can’t use it to generate a category axis.
I needed a way of generating the running count for the x-axis in a way that uses Analysis Services’ excellent aggregation ability.
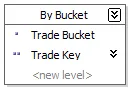 The solution I ended up with is to create an artificial hierarchy and bucket transactions. That way I can create an attribute relation for aggregation and, importantly, control the number of cells in the iteration.
The next problem was how to assign values to this bucket – some customers had only a few transactions yet others had millions. They all needed to be spread over a fixed set of buckets.
The answer lies in a SQL Server RANK() function:
update dw.Sales
set TradeBucket = x.TradeBucket
from (
    select TradeKey,
    rank() over(partition by CustomerKey order by t.TradeKey asc) /
    case
        when (select COUNT(*) from dw.Sales where CustomerKey = t.CustomerKey) < 1000 then 1
        when (select COUNT(*) from dw.Sales where CustomerKey = t.CustomerKey) < 10000 then 10
        when (select COUNT(*) from dw.Sales where CustomerKey = t.CustomerKey) < 100000 then 100
        when (select COUNT(*) from dw.Sales where CustomerKey = t.CustomerKey) < 1000000 then 1000
        else 10000
    end as TradeBucket
    from dw.Sales
) x
where dw.Sales.TradeKey = x.TradeKey
Effectively, we are generating an incrementing number on a per customer basis and then dividing that number to compress the range. This is surprisingly fast to execute.
Once everything is processed, my new MDX looks like:
With Member [Measures].[Running Sum]
As
    Sum(
        {Null : [Internet Sales Order Details].[Trade Bucket].CurrentMember},
        [Measures].[Internet Gross Profit]
    )
Member [Measures].[Running Count] As
 Sum(
 {Null : [Internet Sales Order Details].[Trade Bucket].CurrentMember},
 [Measures].[Sales Count]
 )
Select {
 [Measures].[Running Count],
 [Measures].[Internet Gross Profit],
 [Measures].[Running Sum]
} On 0, Non Empty {
 [Internet Sales Order Details].[Trade Bucket].Children
} On 1
From [Adventure Works]
Where (
 [Customer].[Customer].[Brian Watson]
)
It works on aggregated data; there are still around 1000 points which is just fine on the graph and it executes in around 3 seconds. So all good?
Well, for now yes but I can see a problem looming – every time I do an import I update every fact row and fully reprocess the cube. That isn’t going to scale long-term. I will probably have to implement some sort of bucket partition strategy.
Discuss this on Twitter or LinkedIn